Investment logic: main music business, profit quality and net cash discount
Main line of analysis:The investment value of TME depends on three things: whether music-related revenue can continue to grow, whether gross margins and non-IFRS profit margins can remain high, and whether 41 billion yuan in cash and fixed deposits can be converted into per-share value through dividends, buybacks, or high-quality inputs.TME Q1 2026 results
| Topic | factual basis | Analyze meaning |
|---|---|---|
| core issues | TME has shifted from being driven by social entertainment to being driven by music membership, SVIP, advertising/IP and offline performances. | The core question is: can TME's music subscription and IP ecosystem continue to offset the decline in social entertainment and convert net cash assets into shareholder returns. |
| Main line 1: The main business of music becomes stronger | In FY2025, online music revenue was 26.726 billion yuan, a year-on-year increase of 22.9%; Q1 2026 was renamed music related services, with revenue of 6.514 billion yuan, a year-on-year increase of 12.2%. | The revenue structure has shifted from live broadcast/social entertainment to music memberships, advertising, IP and offline performances, and the quality of profits is closer to that of subscription-based platforms. |
| Main line 2: Decreasing disclosure granularity | The company will stop disclosing quarterly online music MAU, paying users and ARPPU from Q1 2026, and will instead disclose total paying users of music services at the end of the year. | This makes tracking more difficult, requiring investors to replace the original quarterly user funnel with revenue, gross margin, SVIP, content renewals, and cash returns. |
| Main Line Three: Net Cash Chassis | Q1 2026 cash, time deposits and short-term investments totaled 41.00 billion yuan; loans and bills totaled approximately 4.543 billion yuan. | Calculated based on Nasdaq's 2026-06-26 closing price and Q1 diluted ADS, the enterprise value is approximately US$7.8 billion, and FY2025 non-IFRS net profit attributable to the parent company corresponds to EV/profit of approximately 5.6 times. |
Company Profile: What does TME do?
Tencent Music Entertainment Group It is an online music and audio entertainment platform in the Tencent Holdings ecosystem, with NYSE code TME and Hong Kong stock code 1698. The company's 20-F calls it one of China's largest online music entertainment platforms, with core products including QQ Music, Kugou Music, Kuwo Music and National Karaoke.TME 2025 20-F
| question | brief answer |
|---|---|
| Company positioning | Tencent Music Entertainment Group is a Chinese online music and audio entertainment platform whose core applications include QQ Music, Kugou Music, Kuwo Music and National Karaoke. |
| what to sell | It mainly sells services such as music memberships, SVIP, digital albums, advertising, copyright/IP operations, offline performances, and social entertainment virtual gifts. |
| Who to serve | The user end covers Chinese mass music listeners, member users, karaoke and audio users; the B end covers brand advertisers, record companies, artists and content partners. |
| Why is it important | TME also has Tencent ecological traffic, music copyright negotiation, long-tail music library distribution and membership price increase capabilities, and is the core asset of China's paid audio. |
Executive Summary: Investment Conclusion
Investment conclusion:Give TME Observation/positive bias. The company has completed the structural switch from social entertainment to its main music business, and its financial quality is improving in both FY2025 and Q1 2026. On the valuation side, thicker net cash makes EV/profits look attractive; on the risk side, the elimination of quarterly user metrics will drive down external verifiability.
| Dimensions | current judgment | Analyze meaning |
|---|---|---|
| Investment conclusion | Observation/positive bias | TME has shifted from being driven by live streaming to being driven by music subscriptions and IP ecology, with profit margins and cash returns being more critical than revenue growth. |
| main controversy | Low valuations come from slower growth and reduced disclosure granularity | If music-related revenue continues to grow at double digits, there is room for revaluation of the current EV/non-IFRS profit caliber. |
| key moat | Copyright + Tencent Ecosystem + Multi-App Distribution | NetEase Cloud Music is stronger in terms of community tone, and TME is stronger in scale, profit margins and cash reserves. |
| maximum risk | Transparency in user growth decreases | Once quarterly MAU, paid users and ARPPU cease to be disclosed, the market will rely more heavily on verification of financial results. |
Key Takeaways: Core Takeaways
Recent Two-Year Share Price Trend: Stock price trend in the past two years
TME's stock price has fluctuated greatly in the past two years, and the range return from 2024-07-01 to 2026-06-30 is -41.8%. The implication of this analysis is that the market has significantly lowered its expectations for the growth of China's Internet and online music, and subsequent upward movement requires new standards of profit quality, cash returns, and user disclosure to re-establish trust.
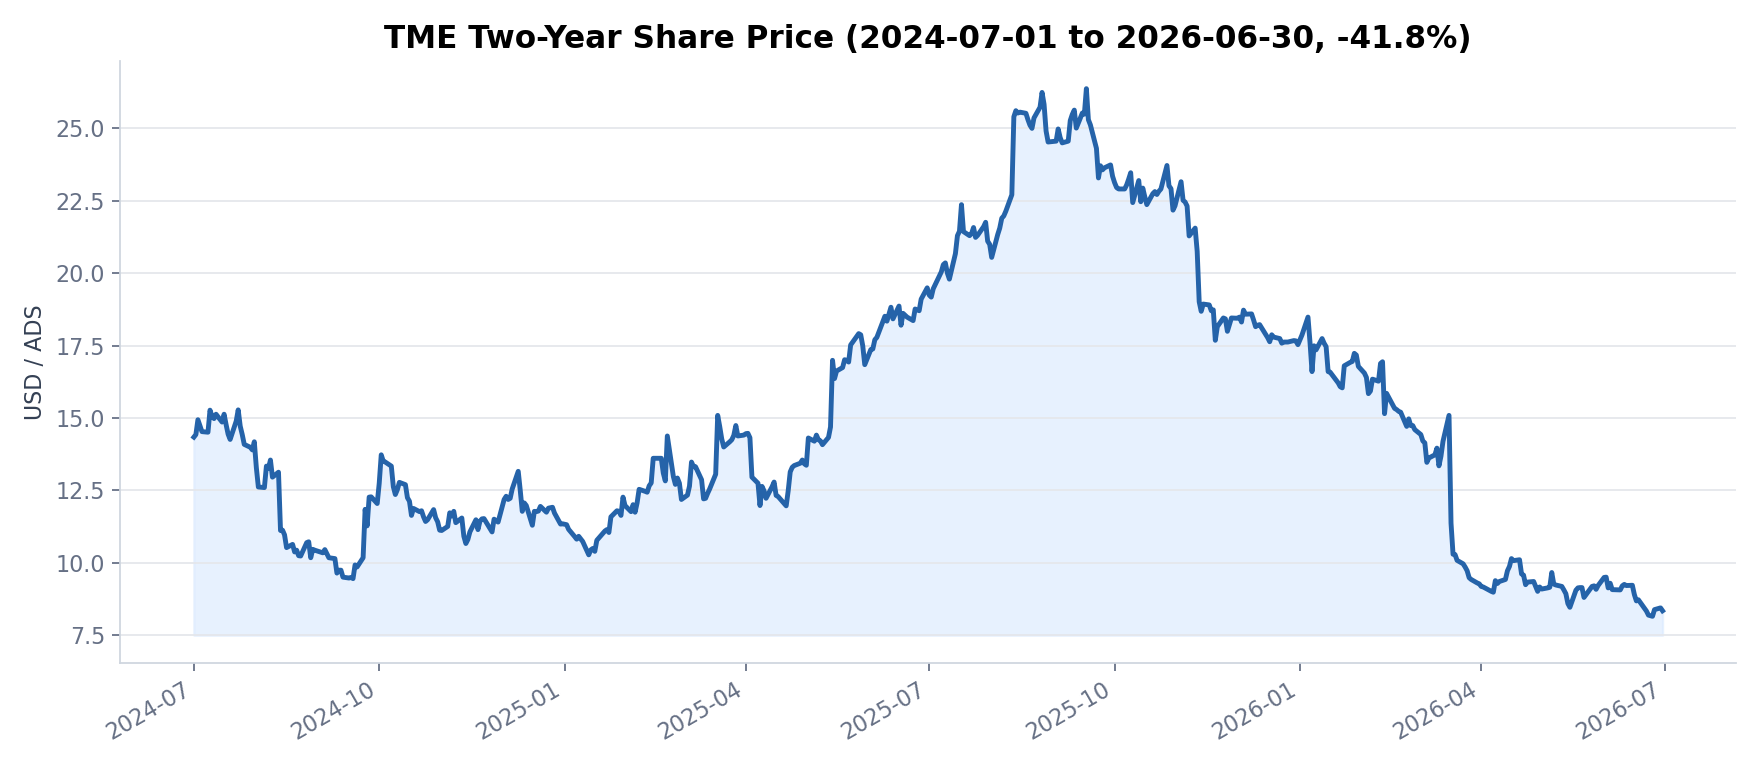
Source: Nasdaq historical API, TME daily close. Last available row in this run: 2026-06-30. Nasdaq TME historical prices
Market/Industry Context: Industry background
The growth of the online music industry has expanded from early MAU to payment rates, membership tiering, IP operations and advertising efficiency. TME needs to prove that its content and platform advantages can translate into higher ARPPU, stronger gross margins and stable cash returns.IFPI Global Music Report 2026
| Dimensions | Industry changes | Meaning for TME |
|---|---|---|
| Industry driven | Music payment rate increase, membership tiering, SVIP, advertising, e-commerce/IP, concerts and fan economy. | TME's growth increasingly relies on per-user wallet share rather than pure MAU expansion. |
| supply side | High-quality copyrights, classic music libraries, artist IPs and platform-made content determine user retention. | TME Q1 2026 renewed contracts with JVR, Linfair, MOK-A-BYE, and deepened cooperation with TF Entertainment. |
| demand side | Chinese users are more accepting of paying for online music, but short videos divert user time. | Subscription price increases and membership benefit expansion need to prevent users from migrating to free/short video consumption. |
| global reference | Spotify Q1 2026 MAU 761m, Premium subscribers 293m, revenue 4.533 billion euros, comprehensive gross profit margin 33%. | Spotify provides a reference for global price increase and gross profit margin improvement; TME relies more on the Chinese market and Tencent ecosystem. |
Company Overview and Segment Quality:Business quality
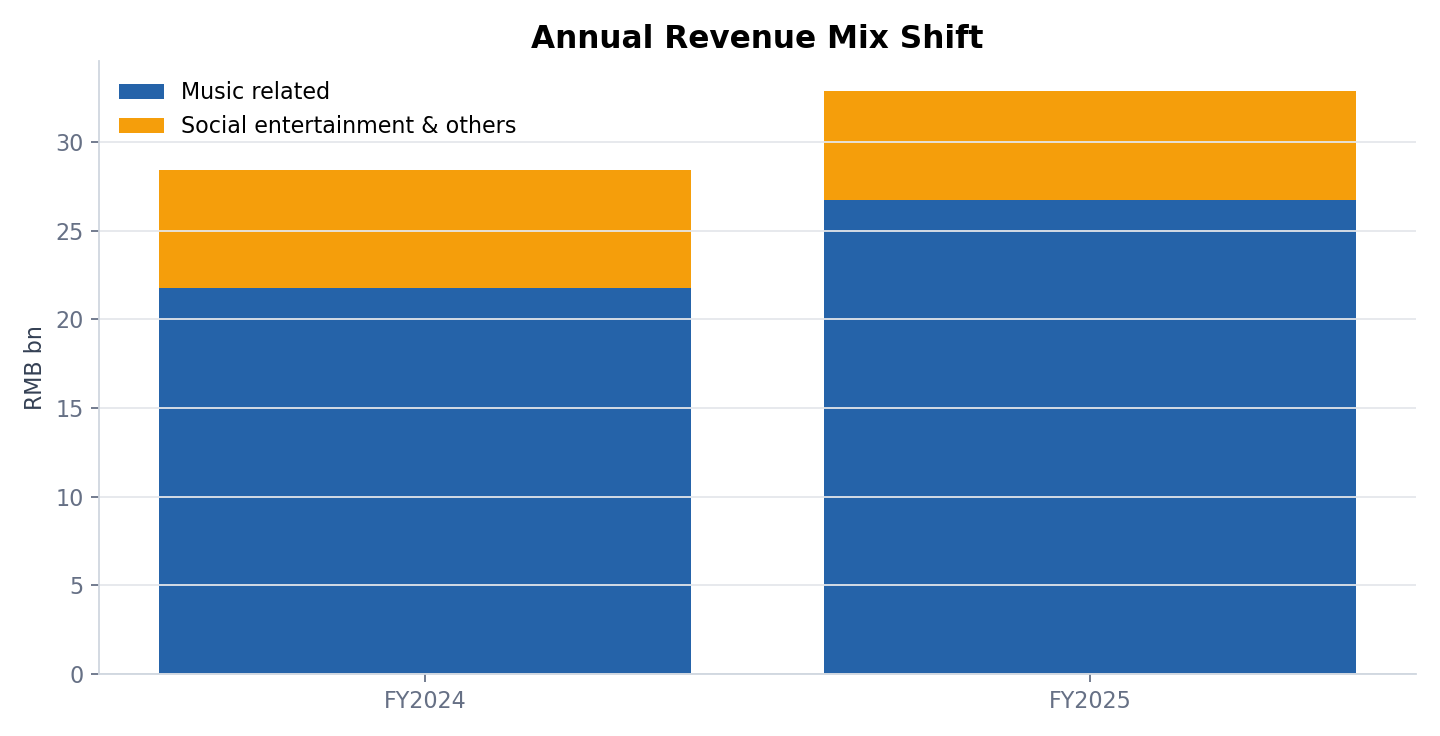
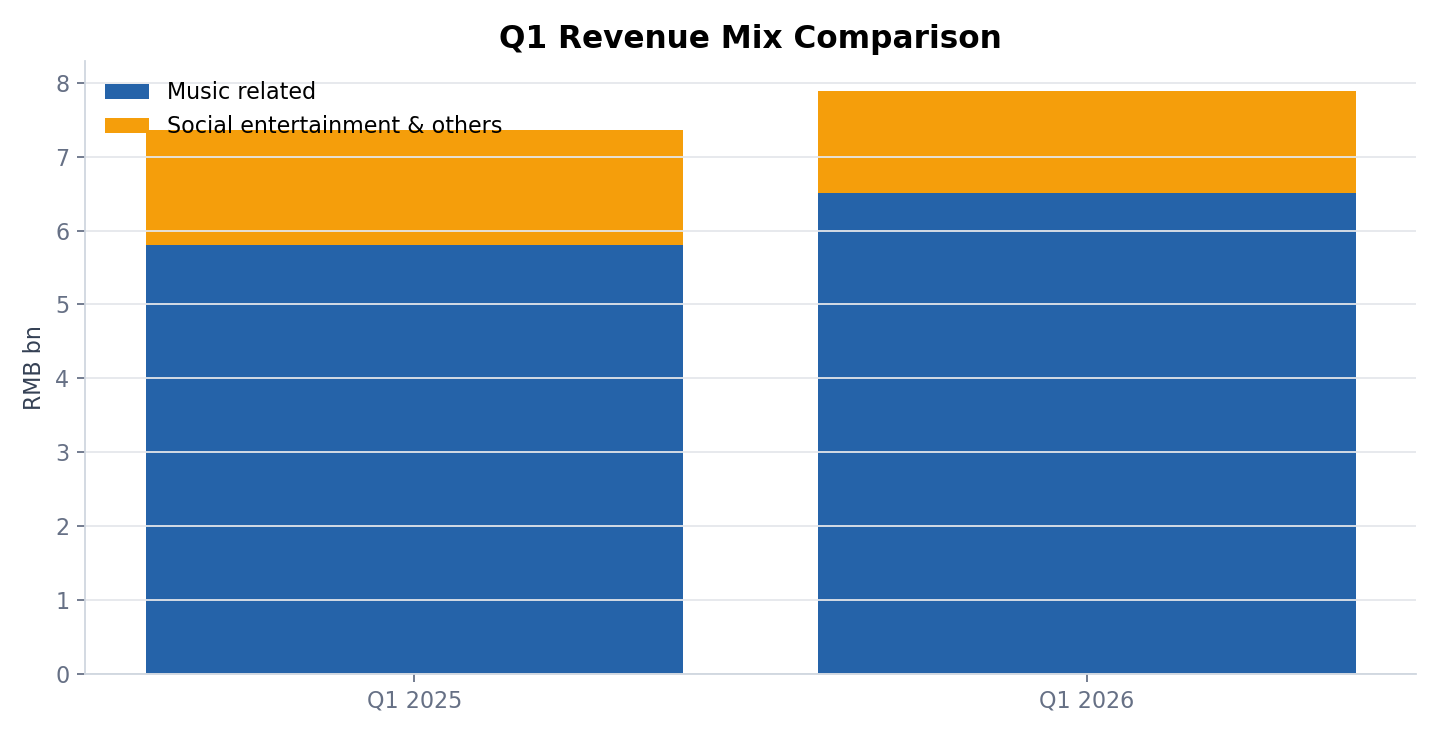
The quality improvement of TME comes from the revenue structure switch. Music-related services grow and social entertainment shrinks; this will reduce live broadcast supervision and sharing pressure, while making membership, advertising and IP the core of profits. The following two revenue structure charts are displayed separately according to the same caliber. The left chart only compares the whole year, and the right chart only compares Q1, so full-year revenue and single-quarter revenue will not be mixed together.
| business line | latest performance | quality judgment |
|---|---|---|
| Music related services | Q1 2026 revenue was 6.514 billion yuan, a year-on-year increase of 12.2%. | The core growth engine is driven by membership, advertising, IP and offline business; the room for improvement in gross profit margin still comes from the decline in membership rights and channel fees. |
| Membership services | Q1 2026 revenue was 4.57 billion yuan, a year-on-year increase of 6.6%. | The highest stability, with more growth coming from ARPPU, SVIP and membership tiering. |
| Music related other services | Q1 2026 revenue was 1.94 billion yuan, a year-on-year increase of 28.0%. | Advertising, offline performances, IP and artist-related services are more flexible, which also brings cost and cycle fluctuations. |
| Social entertainment services and others | Q1 2026 revenue was 1.381 billion yuan, a year-on-year decrease of 11.0%. | Old businesses continue to shrink, and the risk lies in the speed of decline; the benefit is a healthier income structure. |
Income structure conclusion
The total annual revenue in FY2025 was 32.902 billion yuan, an increase of 15.8% compared with FY2024; the total revenue in Q1 2026 was 7.895 billion yuan, an increase of 7.3% compared with Q1 2025. The core change is that the proportion of music-related services has increased and the proportion of social entertainment has decreased.
The chart is organized based on TME FY2025 and Q1 2026 announcements.TME FY2025 results TME Q1 2026 results
Company-Specific Evidence: Company evidence
This page breaks down TME’s argument into four categories of verifiable evidence: content copyright, Tencent ecosystem, membership stratification, and changes in disclosure rules. The first three support growth and the last increases research difficulty.
| evidence | public content | Analyze meaning |
|---|---|---|
| Content copyright | Q1 2026 Renewed contracts with JVR Music, Linfair Records, MOK-A-BYE, etc., covering artists such as Jay Chou, Karen Mok, Yu Chengqing, Angela Chang, etc. | The classic music library enhances member retention and SVIP conversion and is a key asset for TME differentiation. |
| Tencent Ecosystem | Management said it will use the Tencent ecosystem to expand user reach and penetration. | WeChat, QQ, video, games and social relationship chains provide TME with low-cost distribution and publicity scenarios. |
| Membership tiers | Q4 2025 management said SVIP users exceeded 20 million; Q1 2026 continued to mention improvements in SVIP adoption and user interaction. | Price increases and equity stratification are the core of profit growth, but they need to be supported by continued content investment. |
| Disclosure changes | The company will stop disclosing quarterly online music MAU, paying users and ARPPU starting in Q1 2026. | This is an important tracking gap that needs to be verified later with revenue, profit, and year-end paying users. |
Competitor Landscape and Peer Comparison: Competitor Comparison
TME's direct benchmark is NetEase Cloud Music, and its global reference is Spotify. Competition in duration and distribution comes from short video platforms. TME's uniqueness lies in its combination of scale, cash, profit margins and Tencent's ecosystem.NetEase Cloud Music FY2025 Spotify Q1 2026 6-K
| company | core exposed | verifiable information | How to pronounce TME |
|---|---|---|---|
| TME | China Online Music + Audio + Karaoke | FY2025 revenue was 32.90 billion yuan; gross profit margin was 44.2%; non-IFRS net profit attributable to the parent company was 9.59 billion yuan. | The largest scale, strong profit margin, thick net cash, and reduced disclosure granularity are the main deduction items. |
| Soda Music/ByteDance | Independent music app + Douyin music discovery and promotion portal | It is not listed on the market, and its music business lacks independent financial disclosure; its core competitiveness comes from the Douyin ecosystem, algorithm recommendations, free/light membership conversion and new song promotion links. | This is the competitor that TME needs to keep an eye on most: the revenue caliber is not comparable, but it may suppress young user time, advertising/IP growth and new song promotion budget. |
| NetEase Cloud Music | Chinese online music community | FY2025 revenue was 7.8 billion yuan; gross profit margin was 35.7%; net profit was 2.746 billion yuan. | Community and original music have strong tonality, and their scale and profit margin are lower than TME. |
| Spotify | global music streaming | Q1 2026 revenue 4.533 billion euros; Premium subscribers 293m; gross profit margin 33%. | Global price increase and podcast/advertising ecological reference; TME’s Chinese market and Tencent ecological attributes are stronger. |
| Douyin / Kuaishou / Station B | Short videos, live broadcasts, music promotions and user time competition | Independent disclosure is often lacking in the music business. | It is not necessarily a replacement for the same type of music subscription, but it will compete for music discovery, promotion budget and pan-entertainment time. |
Financial Statement Analysis: Financial Analysis
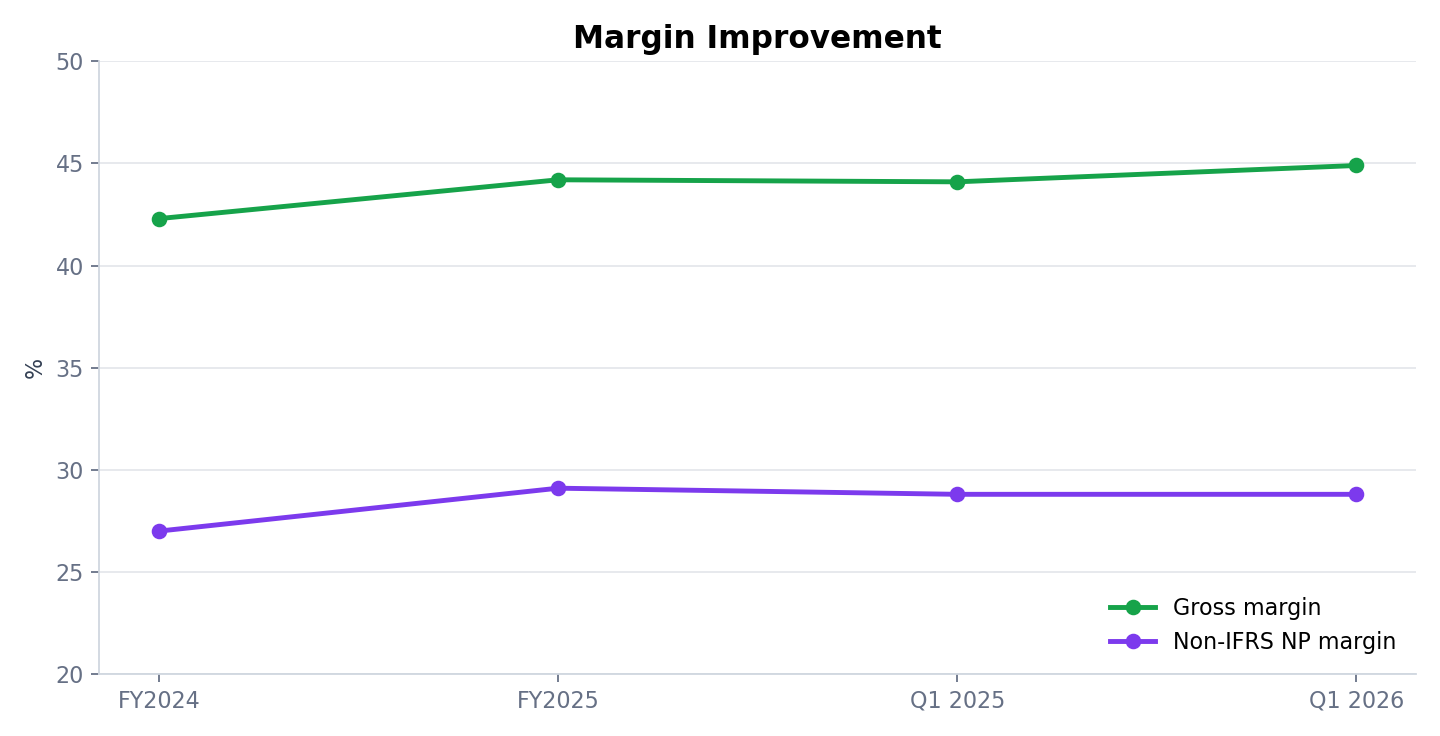
Income statement:In FY2025, total revenue was 32.902 billion yuan, a year-on-year increase of 15.8%; online music revenue was 26.726 billion yuan, a year-on-year increase of 22.9%; gross profit margin rose to 44.2%. Q1 2026 revenue growth dropped to 7.3%, but gross profit margin continued to rise to 44.9%.TME FY2025 results TME Q1 2026 results
| Project | FY2024 RMB bn | FY2025 RMB bn | Year-on-year | Analyze meaning |
|---|---|---|---|---|
| total revenue | 284.01 | 329.02 | +15.8% | Revenue returned to double-digit growth, mainly due to the expansion of online music. |
| Online music/music-related income | 217.42 | 267.26 | +22.9% | The growth rate of core business is significantly higher than that of the company as a whole. |
| Social entertainment and others | 66.59 | 61.76 | -7.3% | Old businesses are still shrinking, but the drag is smaller. |
| Gross profit margin | 42.3% | 44.2% | +1.9ppt | The proportion of members and advertising has increased, and the pressure on sharing has decreased. |
| operating profit | 87.10 | 133.64 | +53.4% | Including investment-related gains and still showing operating leverage. |
| Non-IFRS net profit attributable to parent company | 76.71 | 95.88 | +25.0% | More suitable for observing sustained profitability. |
Q1 2026 Snapshot
| Project | Q1 2025 RMB bn | Q1 2026 RMB bn | Year-on-year |
|---|---|---|---|
| total revenue | 73.56 | 78.95 | +7.3% |
| Music related services | 58.04 | 65.14 | +12.2% |
| Member services | 42.84 | 45.70 | +6.6% |
| Other music related services | 15.20 | 19.44 | +28.0% |
| Social entertainment and others | 15.52 | 13.81 | -11.0% |
| Gross profit margin | 44.1% | 44.9% | +0.8ppt |
| Non-IFRS net profit attributable to parent company | 21.2 | 22.7 | +7.0% |
Balance Sheet:Q1 2026 cash, time deposits and short-term investments totaled 41.00 billion yuan, loans and bills totaled approximately 4.543 billion yuan, and net cash was approximately 36.46 billion yuan. In terms of cash flow, Q1 2026 operating cash flow was 2.332 billion yuan.TME Q1 2026 results
Net book value vs. market value
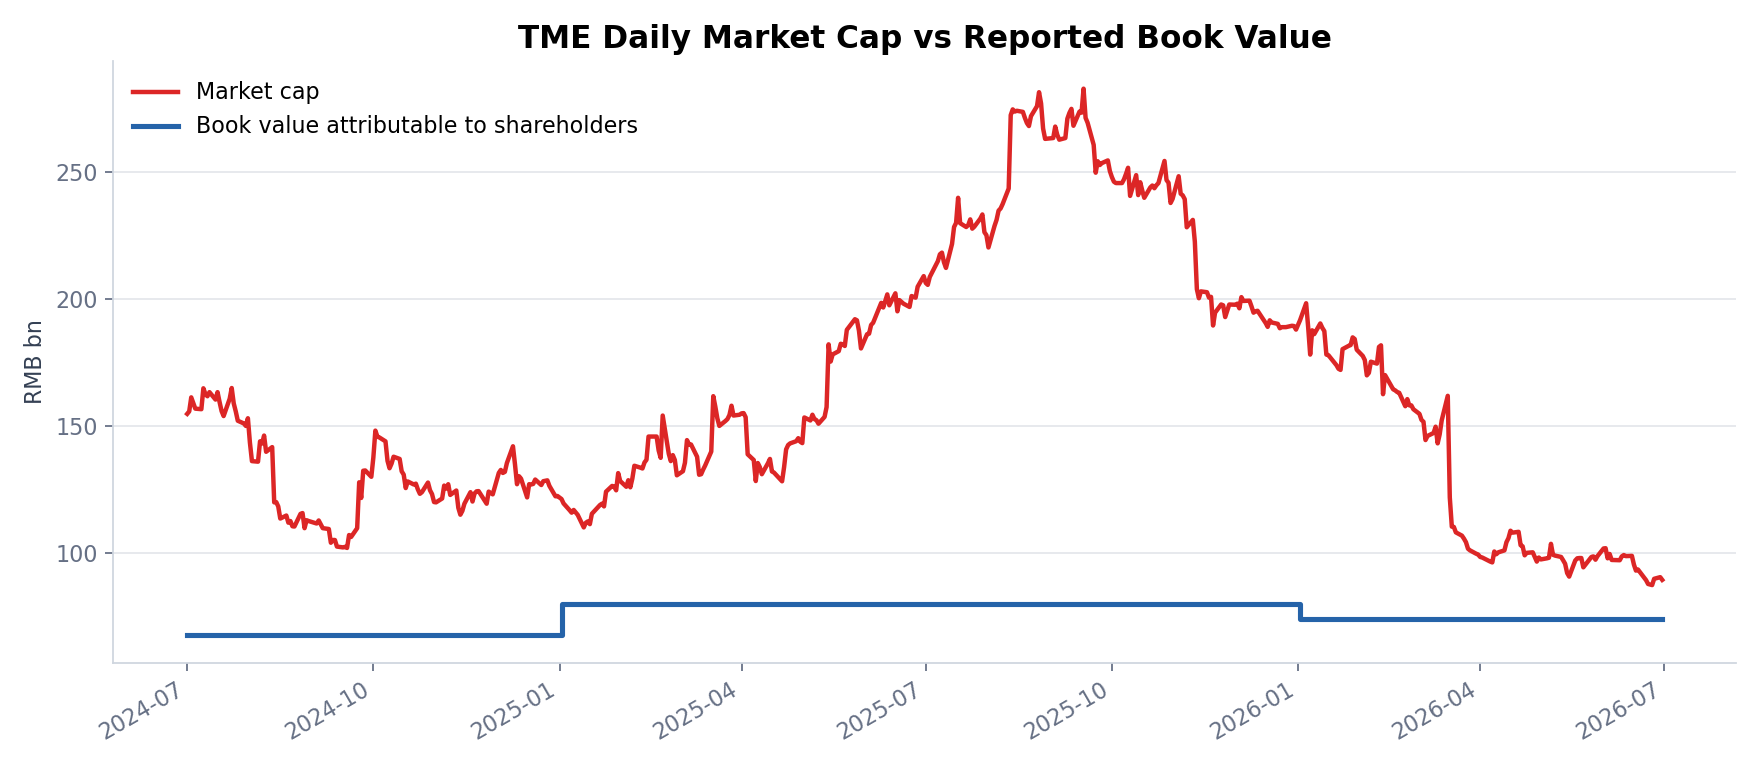
The "net value" here refers to the net book assets attributable to the company's shareholders. The red line is the daily market capitalization, which is estimated by multiplying the daily closing price of Nasdaq ADS by the number of diluted ADSs, and uniformly converted into RMB using RMB6.8980/USD; the blue line is the ladder line of net book value after performance disclosure. TME's market value will be significantly higher than its net book value in 2025. After the stock price fell back in the first half of 2026, the distance between market value and net book value narrowed significantly.Nasdaq TME historical prices TME Q1 2026 results
| time | Net assets attributable to parent company RMB bn | Indicated market value RMB bn | Market value/net value | Description |
|---|---|---|---|---|
| FY2024 | 67.86 | 122.6 | 1.8x | The net assets attributable to the parent are from the FY2025 announcement balance sheet; the market value is estimated using the closing price of Nasdaq ADS around 2024-12-31. |
| FY2025 | 80.29 | 188.0 | 2.3x | Gui Mu's net assets continued to grow, and the market value premium expanded. The market priced the music platform's profits and cash flow at a higher price at that time. |
| Q1 2026 | 74.34 | 99.6 | 1.3x | Net assets attributable to the parent company declined due to changes in other reserves; after the market value fell, the price-to-book ratio was compressed. |
| 2026-06-26 | 74.34 | 90.0 | 1.2x | The latest net worth follows the Q1 2026 net assets attributed to the parent; the market value is estimated based on the closing price on June 26, 2026. |
Net Asset Composition: net asset composition
As of Q1 2026, TME's total assets are approximately 99.85 billion yuan, total liabilities are approximately 22.72 billion yuan, and total equity is approximately 77.13 billion yuan, of which net assets attributable to the parent company are approximately 74.34 billion yuan. The key here is not to simply look at PB, but to break down how much of the net assets is cash, how much is financial asset valuation, and how much is goodwill and intangible assets.TME Q1 2026 balance sheet
| Project | Q1 2026 RMB bn | Share of total assets/equity attributable to parent | Analyze meaning |
|---|---|---|---|
| total assets | 99.85 | 100.0% | Q1 2026 asset base; a decrease of approximately 2.67 billion yuan from 102.52 billion yuan at the end of FY2025. |
| Cash, cash equivalents and time deposits | 41.00 | 41.1% | The hardest asset layer; after covering all liabilities of 2.272 billion yuan, there is still a buffer of approximately 1.828 billion yuan. |
| Goodwill + Intangible Assets | 23.30 | 23.3% | Mainly from historical acquisitions and identifiable intangible assets, which can support the value of the platform, but cannot be equivalent to immediately distributable cash. |
| FVOCI financial assets | 19.87 | 19.9% | Q1 decreased by approximately 6.37 billion yuan compared with the end of FY2025, which is an important source of fluctuations in book net assets. |
| Receivables + current operating assets such as advance payments/deposits | 7.86 | 7.9% | Reflecting the operating turnover of advertising, IP, performances, copyrights and platform settlement, it is not the main safety cushion for valuation. |
| total liabilities | (22.72) | (22.8%) | The debt ratio is not high; current liabilities are 1.662 billion yuan, accounting for about 73% of total liabilities. The total amount of loans and bills is approximately 4.543 billion yuan. |
| Net assets attributable to parent company | 74.34 | 74.5% | The actual book net assets corresponding to ADS shareholders; net cash is approximately 36.46 billion yuan, equivalent to approximately 49% of the net assets attributable to the parent company. |
Internal composition of equity owned by the parent
| equity items | Q1 2026 RMB bn | Ownership of equity | pronunciation |
|---|---|---|---|
| Additional paid-in capital | 30.02 | 40.4% | Historical equity premium and capital investment are one of the largest single items of equity book value. |
| Retained earnings | 28.65 | 38.5% | The cumulative profit layer shows that TME has continued to precipitate net assets from the income statement; Q1 2026 has declined due to the impact of dividend announcements and other factors. |
| Other reserves | 17.16 | 23.1% | The most volatile items that need to be monitored usually include changes in FVOCI, foreign currency translation and other equity reserves; Q1 2026 will decrease by approximately 5.29 billion yuan compared with the end of the year. |
| Shares held / treasury shares | (1.49) | (2.0%) | Equity deductions formed by share-based incentives and treasury shares. |
| Non-controlling interests | 2.79 | 3.6% of total equity | It belongs to a minority shareholder and is not owned by ADS shareholders; when looking at the value of ADS, the net assets owned by the parent should be used first. |
How to read net worth
- The quality of net assets is clearly stratified.The hardest part is 41.0 billion yuan in cash, cash equivalents and time deposits; followed by FVOCI financial assets; goodwill and intangible assets support the value of the platform, but should not be treated as cash safety pads.
- The real safety cushion is net cash.After deducting borrowings and notes, net cash is approximately 36.46 billion yuan, which is approximately 49% of net assets attributable to the parent, and is also the key to why EV/profit looks cheap.
- The decline in net assets in Q1 2026 is not mainly due to deterioration in operations.Net assets attributable to the parent company dropped from 80.29 billion yuan to 74.34 billion yuan, with the biggest drag coming from the decline in other reserves; the income statement still showed Q1 net profit attributable to the parent company of 2.091 billion yuan.
Note: The cash layer uses the cash, cash equivalents, term deposits and short-term investments disclosed by the company; the net assets attributable to the parent company use equity attributable to equity holders of the Company. Percentages are rounded to Q1 2026 reporting numbers.
Forecast Model and Operating Bridge: Forecast Bridge
The following are schematic calculations used to understand operating leverage; they are not company guidance. The key variables of TME are music-related revenue growth, member/SVIP ARPPU, advertising/IP/offline revenue elasticity, social entertainment decline rate and gross profit margin.
| Scenario | core assumptions | 2026 Indicative results | Valuation meaning |
|---|---|---|---|
| Bear | 2026 revenue +5%, non-IFRS net margin 27%; social entertainment continues to decline, and music-related revenue falls to high single digits. | Revenue is approximately 34.5 billion yuan; non-IFRS net profit attributable to the parent company is approximately 9.3 billion yuan. | Valuation is mainly supported by net cash and dividends. |
| Base | 2026 revenue +10%, non-IFRS net profit margin 30%; membership is steadily increasing, and advertising/IP/offline volume continues to increase. | Revenue is approximately 36.2 billion yuan; non-IFRS net profit attributable to the parent company is approximately 10.9 billion yuan. | EV/profit remains low, with room for moderate re-rating. |
| Bull | 2026 revenue +15%, non-IFRS net profit margin 31%; SVIP, advertising and IP businesses jointly exceeded expectations. | Revenue is approximately 37.8 billion yuan; non-IFRS net profit attributable to the parent company is approximately 11.7 billion yuan. | The market may reprice towards high-quality subscription platforms. |
Valuation: valuation
Based on Nasdaq 2026-06-26 closing price $8.39, Q1 2026 diluted ADS 1555.7m It is estimated that the equity value is approximately $13.1bn. After net cash approx. $5.3bn Afterwards, the enterprise value is approx. $7.8bn. FY2025 non-IFRS net profit attributable to parent company is approximately USD $1.39bn, corresponding to EV/profit of approximately 5.6x。Nasdaq TME historical prices TME FY2025 results
| Scenario | Valuation caliber | Profit basis | Indicates ADS value |
|---|---|---|---|
| Current indication | $8.39 ADS; EV approximately $7.8bn | FY2025 non-IFRS net profit attributable to parent company is approximately $1.39bn | EV/non-IFRS net profit approximately 5.6x |
| Bear | 5x EV/non-IFRS net profit | The net profit of 2026 Bear will be about 9.3 billion yuan | Operating assets are approximately $6.7 billion, or approximately $7.7/ADS after adding net cash. |
| Base | 8x EV/non-IFRS net profit | Net profit using 2026 Base is about 10.9 billion yuan | Operating assets are approximately $12.6 billion, or approximately $11.5/ADS after adding net cash. |
| Bull | 11x EV/non-IFRS net profit | The net profit of 2026 Bull will be about 11.7 billion yuan | Operating assets are approximately $18.7 billion, or approximately $15.4/ADS after adding net cash. |
The valuation is an indicative calculation, using the RMB6.8980/USD exchange rate in the TME announcement, Nasdaq closing price, and Q1 2026 diluted ADSs. Actual share count, exchange rates, cash usage and market multiples will affect results.TME Q1 2026 results
Catalysts and Monitoring Checklist: Catalysts and Monitoring Checklist
forward catalysis
- The disclosure of total paying users of music services in 2026 reaffirms the quality of paying user growth.
- The number of SVIP users, ARPPU or membership rights upgrades continue to drive high-quality growth in membership revenue.
- Revenue from advertising, IP, offline performances and artist peripherals maintained a growth rate of over 20%.
- Further dividends or buybacks will allow 41 billion yuan in cash and fixed deposits to be converted into per-share value.
- Renewed contracts with leading record labels and artists to continue to consolidate classic music library and exclusive/window period content.
negative catalysis
- After stopping the disclosure of quarterly MAU, paying users and ARPPU, the market cannot judge the user funnel in a timely manner.
- Soda music and short video platforms take away music discovery, young user time and publicity budget, and advertising/IP growth is less than expected.
- Copyright renewal costs, artist IP or offline performance costs have increased, and gross profit margins have fallen.
- Regulations impose stricter requirements on live broadcasts, virtual gifts, protection of minors or platform algorithms.
- The decline in social entertainment expanded again, offsetting the growth in music-related services.
Follow-up checklist
| time | milestone | What needs to be verified |
|---|---|---|
| 2026Q2-Q3 | Music-related revenue growth | Observe whether membership income, advertising/IP/offline income can maintain double-digit growth. |
| 2026Q4 / FY2026 | Total paying users of music services at the end of the year | This is a key user verification point following changes to disclosure rules. |
| 2026 full year | shareholder returns | Observe annual dividend, buyback or cash usage policies. |
| Every performance meeting | Content Renewal and SVIP | Pay attention to whether content cooperation with JVR, TF Entertainment and other companies will bring about improvements in ARPPU and retention. |
key risks
- Disclosure Risks:After the quarterly user indicators are cancelled, external tracking can only rely on revenue, profit and the number of users at the end of the year, and the market discount may expand.
- Growth slows:The growth rate of membership services in Q1 2026 is 6.6%. If SVIP and ARPPU are not improved enough, the overall revenue growth rate will fall back to single digits.
- Copyright cost:Classic music libraries and leading artists can bring membership value, but may also drive up copyright and IP costs.
- Soda music competes with short videos:Soda music is backed by the Byte/Douyin ecosystem, with Douyin, Kuaishou and Bilibili competing for music discovery, promotion and user time, affecting TME’s advertising and reaching young users.
- Governance and supervision:The VIE structure, Tencent Holdings shareholder relations, live broadcast/virtual gift regulation and content moderation are all long-term risks.
Questions for Management:Management questions
- Now that it stops disclosing quarterly MAUs, paying users, and ARPPU, what alternative metrics are the company preparing to use to help investors track membership quality?
- What is the next stage goal after SVIP exceeds 20 million users, and what is the range of SVIP’s contribution to ARPPU and retention?
- Among the 28% growth rate of other music-related services, how much do advertising, offline performances, IP and artist peripherals contribute respectively?
- What is the priority for long-term capital allocation of 41 billion yuan in cash and time deposits: dividends, buybacks, copyrights, mergers and acquisitions or ecological investment?
- How to strike a balance between the transparency of related transactions and business efficiency when cooperating with Tencent Ecosystem’s traffic and content?
- Faced with the pressure from Soda Music/ByteDance on young users, algorithm recommendations and new song announcements, how can TME maintain its advantages in content discovery and community interaction?